Marketing decisions today are built on more than instinct—they’re built on data. And when it comes to QR code marketing statistics, the numbers speak volumes. From tracking QR code scans to analyzing engagement and conversion rates, these insights help marketers fine-tune campaigns, understand behavior, and drive real results. If you’re serious about using QR codes strategically, especially considering QR code adoption the stats are your compass.
Data-driven marketing: A modern imperative
Modern marketing runs on data—or it doesn’t run at all. The days of blasting generic messages to the masses are over. Today, smart brands leverage the use of QR codes and analytics tools to zero in on what really works. By breaking down audiences into meaningful segments and tailoring messages that stick, marketers aren’t just reaching people—they’re resonating with them.
Even small businesses can tap into this precision. Platforms like QR Code KIT make it easy for QR code creation and to collect real-time insights without big budgets or complex setups. Want to know how many users scanned a QR code, where they were, or which phone they used? It’s all trackable. That’s a far cry from the guesswork of traditional print ads, where measuring impact often meant hoping for the best.

Why statistical data matters in marketing
In marketing, clarity beats guesswork. Statistical data, including QR code trends, doesn’t just remove uncertainty—it points you in the right direction. Here’s why these numbers are the backbone of smart decision-making:
Measuring campaign effectiveness
Every campaign has a job to do—whether it’s a QR code on food packaging or a splashy digital banner. But how do you know it worked? QR code scan data, especially when QR code scans surged, gives you hard answers. You can see exactly how many people engaged, what pages they visited, and whether they came back. That’s not just feedback—it’s fuel for your next move.

Audience understanding
You can’t market to a blur. Stats help sharpen the picture. Age, gender, device, location—suddenly your audience has a face. If QR Code KIT reveals that most scans come from Android users in South America during evening hours, that’s not trivia—it’s your blueprint for timing, language, and format.
Optimization and adjustment
Marketing is never set-and-forget. When one QR code campaign underperforms in a region, real-time stats let you shift gears fast. Maybe print posters are falling flat, but in-store displays are thriving. Or maybe your content hits better in the morning than late at night. With data on your side, every tweak has purpose.
Forecasting and trend identification
Data isn’t just a rearview mirror—it’s a crystal ball. If your QR code usage statistics show a steady rise in scans month after month, it signals more than success—it shows growing user trust and comfort with QR code technology. That kind of trend shapes future campaigns, guides your budget, and helps your brand stay one step ahead.
Data categories in marketing analytics
Not all data, especially related to mobile payments, is created equal. In QR code marketing, different types of insights tell different parts of the story—and together, they help sharpen your strategy.

Descriptive data
This is your starting point—the “what happened” view. It includes total QR code scans, unique QR code users, and how many campaigns you’ve launched. It’s the snapshot that tells you how your efforts, including standard QR codes, are performing at a glance.
Diagnostic data
Here’s where we ask “why.” If scans suddenly drop, including those from regular QR code diagnostic insights help connect the dots. Maybe the QR code on your store display got removed. Maybe the link was broken. This data shows you what disrupted the experience.
Predictive data
Using historical trends, predictive data helps forecast what’s likely to happen next. If engagement reliably peaks on weekends or after product launches, especially regarding QR code payment you can plan ahead. It’s how marketers stay one step in front.
Prescriptive data
The most advanced category—this data doesn’t just describe or predict. It recommends. While QR Code KIT may not yet offer full-blown prescriptive analytics, the insights that QR codes offer combined with tools like Google Analytics opens the door to AI-powered suggestions and sharper campaign moves.
Benefits of using statistical data in QR code marketing
Harnessing data doesn’t just make your QR code campaigns smarter—it makes them perform better across the board. When you understand how, when, and where people scan QR codes, you can fine-tune your marketing strategies and get the most out of every touchpoint. Here’s what the numbers unlock, helping brands and consumers find QR codes :

Personalization
In today’s digital marketing landscape, personalization isn’t optional—it’s expected. QR code marketing statistics show that QR adoption is influenced by customized QR codes tied to personal experiences (like name-based content, dynamic QR codes, or digital business cards) result in significantly higher engagement. Tailored landing pages, time-limited offers, and personalized CTAs can transform a standard scan into a memorable moment that drives loyalty.
Geotargeting and localization
Stats on QR code usage by location open the door to highly targeted local campaigns. Imagine a global brand analyzing global QR code scans and discovering that QR code menus are booming in one region but underused in another. That insight lets them adapt promotions for inventory management by country, city, or even neighborhood—perfect for industries like retail, tourism, and food packaging.
Improved customer journey mapping
Knowing where your audience encounters your quick response codes—on a print ad, a retail shelf, or mid-checkout via contactless menus—helps you understand their path. You see where QR scanners engage, where they drop off, and where a better CTA or landing page could boost conversions. This is especially valuable for brands integrating QR experiences across both the physical and digital worlds.
Cost-effective decision making
Data-driven marketing saves money. If one QR code scanner campaign underperforms while another thrives, it’s clear where to redirect your ad spend. QR code statistics give you a real-time view of performance so you can adjust without delay. For marketers managing tight budgets or juggling multiple channels, it’s the difference between spending and investing.
Real-world applications: Statistical data at work
QR code marketing statistics aren’t just numbers—they’re decision-making tools used across industries. From boosting engagement to fine-tuning experiences, data shows where QR codes work and how to make them work better. Here’s how different sectors put that insight to use:

Retail and eCommerce
Retailers and online brands rely on QR code scans to track shopper behavior and test what drives conversions. A fashion retailer might add marketing QR codes to in-store displays or product packaging, linking to exclusive discounts or an online catalog. Once deployed, statistical data reveals which locations, times, and even display designs result in the most engagement—helping them optimize layouts and promotions on the fly.
Food and beverage
QR codes on food packaging do more than just list ingredients—they connect consumers to sourcing details, limited-time offers, or interactive brand stories. QR code usage statistics help brands figure out which campaigns spark the most interaction and which products are pulling in scans across the distribution chain. It’s a key tool for both smart packaging and customer loyalty.
Event marketing
At live events, QR code technology powers everything from ticketing to speaker schedules. But it’s the analytics behind the scans that drive event improvement. Organizers track global scans to see which signs or materials grabbed attention and when. This feedback loop helps refine future marketing campaigns, adjust offline marketing assets, and improve audience flow across venues.
Healthcare and education
Even traditionally offline sectors are going digital. Hospitals now use QR codes to streamline access to digital forms and medical info, reducing paperwork and improving accuracy. On campus, universities attach QR codes to brochures and admissions posters, collecting data on which programs or faculties are attracting attention. These stats guide recruitment, outreach, and even course offerings.
Turning data into action
Data is only valuable if you do something with it. In QR code marketing, numbers aren’t the final step—they’re the fuel for smarter moves and sharper campaigns. Here’s how marketers turn QR code marketing statistics into meaningful results.
A/B testing
Run two versions of a campaign—same message, different QR code design or placement—and compare the scan results. Maybe one version is printed on a product box, while the other appears in a print ad. The QR code scans tell you exactly which one resonates. With real-time feedback, you can pivot fast and focus on what works.
User funnel tracking
By assigning a unique QR code to each stage of a marketing funnel, you can trace exactly where users engage and where they fall off. Are they scanning but not converting? Are they clicking through but not purchasing? QR code usage statistics help break down behavior across the customer journey.
Segment-specific offers
Not every audience reacts the same way. Segment your users by location, age, or device type and deliver tailored QR experiences. If smartphone users in one region engage more frequently, offer them a special discount. Customized QR codes allow you to adjust campaigns on a granular level—personalized, but at scale.
Incentivization
Sometimes a little push goes a long way. If your QR code statistics show low engagement in certain areas or time slots, introduce urgency. Limited-time deals, loyalty points, or exclusive access can turn hesitation into action. These kinds of rewards pair especially well with mobile QR code scanners at checkout or in-store displays.
Iteration and feedback
Great campaigns are rarely one-and-done. Combine scan analytics with direct customer input—surveys, feedback forms, or comments accessed via dynamic QR codes. This blend of quantitative and qualitative data helps refine your messaging, update features, and boost future engagement.
Data ethics and user trust
As powerful as QR code marketing statistics are, they come with responsibility. Behind every scan is a real person—and protecting that person’s privacy is non-negotiable. Ethical data use isn’t just a compliance issue; it’s a brand trust issue.
Reputable platforms like QR Code KIT never collect personally identifiable information (PII) unless users choose to share it. That means every time someone scans your QR code, they’re doing so in a safe, transparent environment. Features like opt-in forms, GDPR-compliant disclosures, and secure redirects help users feel in control—because they are.
Trust is the foundation of lasting engagement. When users know they can scan QR codes without worrying about malicious QR codes or hidden data grabs, they’re more likely to engage again. And that trust fuels better customer experiences, stronger marketing campaigns, and more reliable QR code statistics.
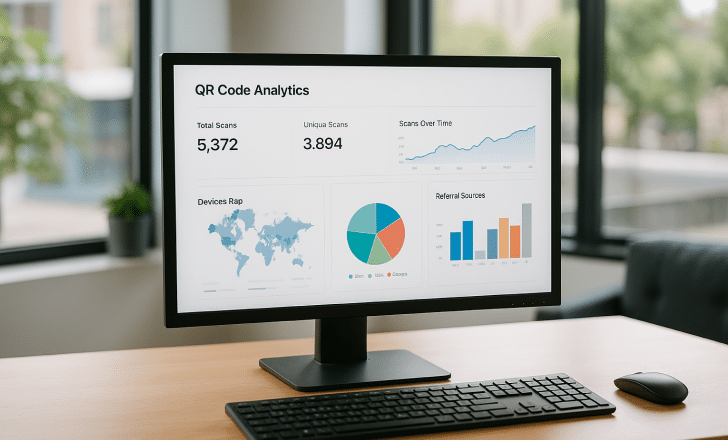
QR Code KIT, a leading dynamic QR code platform, offers detailed analytics that go beyond the basics. From geographical reach and device types to scan frequency and engagement timing, the platform delivers valuable insights to optimize every aspect of your campaign. Whether you’re analyzing mobile QR code scanners, regional trends, or conversion funnels, you’ll find the data you need to make better, smarter decisions.
Looking to dive deeper into the numbers? Check out our full guide on how to view and interpret campaign performance inside the QR Code KIT dashboard.

Accessing QR code statistics in QR Code KIT
Ready to turn your scan data into insight? With QR Code KIT, it’s easy to view and analyze the performance of your QR code campaigns. Here’s how to get started:
1. Log into your account
Head to the QR Code KIT app or web interface and sign in with your credentials. To unlock advanced QR code statistics—including detailed scan data, device breakdowns, and location tracking—make sure you’re on a supported plan (Standard, Professional, or Enterprise). Need help? Visit help.qrcodekit.com
2. Navigate to the dashboard
Once you’re in, you’ll land on your personal dashboard. This is your command center, showing all your dynamic QR codes at a glance. You’ll see key metrics for each one: total QR code scans, recent activity, and overall performance.
3. Select the QR code for detailed statistics
Want to go deeper? Click on the specific QR code you want to analyze. You’ll be taken to a detailed stats page showing everything from scan frequency and device types to geographical distribution and user engagement patterns. It’s all designed to help you leverage QR codes more strategically—and optimize based on real-world data.
Understanding the available statistics
QR Code KIT offers a rich suite of analytics to help you track performance, spot trends, and fine-tune your QR code marketing efforts. Here’s a breakdown of the key metrics available in your dashboard—and how to use them effectively.
1. Total scans
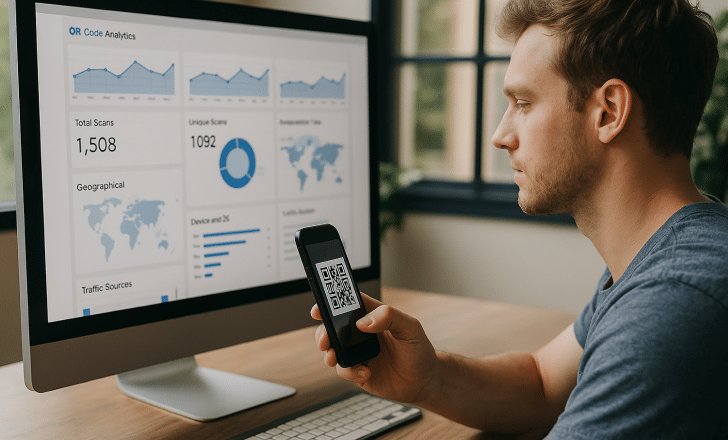
This shows the total number of times your QR code has been scanned—whether by returning visitors or first-timers. It’s your go-to metric for gauging global QR code usage and measuring the overall visibility of your campaign.
2. Unique scans
Unique scans count the number of individual devices that have interacted with your QR code. This gives you a clearer picture of how many actual QR code users you’re reaching—crucial for understanding audience size and true engagement.
3. Scan time and date
Timing matters. By reviewing when people scan QR codes, you can identify peak hours or days. These insights help you optimize publishing schedules, push personalized marketing campaigns, and boost interaction rates.
4. Geographical data
QR Code KIT captures the location of every scan, letting you see where your audience is engaging. Whether you’re testing food packaging QR codes across regions or planning location-based promotions, this geo-data gives you the edge in global QR code marketing.
5. Device and operating system
Want to know if your users are Android users or iPhone loyalists? Are they scanning with tablets or mobile phones? This data helps you ensure compatibility across devices and tailor experiences for better customer engagement.
6. Browser information
Landing pages need to load fast and look right—no matter the browser. With browser insights, you can troubleshoot rendering issues and make sure every scan delivers a smooth, optimized experience.
7. Traffic sources
Where are your scans coming from—print ads, social media, product labels, or in-store posters? Knowing the source of your QR code scans helps you compare offline marketing with digital efforts, and refine your marketing strategies for maximum reach.
Exporting and utilizing the data
Sometimes, you need your numbers outside the dashboard. QR Code KIT makes it easy to export your QR code marketing statistics in PDF or XLS format—perfect for deeper dives, monthly reports, or team presentations.
Whether you’re analyzing global QR code scans, comparing campaign performance, or highlighting key wins in a stakeholder meeting, this export feature turns your QR code usage statistics into shareable insights. It also makes it easier to plug your data into larger digital marketing dashboards or marketing strategies that go beyond QR alone.
Need help with exporting or formatting? Visit help.qrcodekit.com

Enhancing campaigns with QR Code KIT analytics
Great campaigns aren’t built on guesses—they’re built on data. With QR Code KIT’s real-time analytics, you’re not just watching numbers—you’re uncovering patterns that fuel smarter marketing strategies.
If your QR code statistics reveal that most users scan from mobile devices, it’s time to make sure your landing pages are lightning-fast and mobile-optimized. If your data shows peak engagement on Friday evenings, that’s your cue to time promos or personalized marketing campaigns for the win.
By continuously tracking and adjusting based on QR code marketing statistics, businesses can unlock better performance, stronger engagement, and higher ROI. With the right insights, every scan becomes a step toward smarter growth.

Conclusion
In today’s landscape, statistical data isn’t just helpful—it’s the engine behind every smart marketing campaign. It empowers brands to understand their audience, fine-tune messaging, and deliver experiences that actually connect. And in the world of QR code marketing, platforms like QR Code KIT make real-time insights not only accessible, but actionable.
When used with care and strategy, data doesn’t just inform—it transforms. It turns passive scans into dynamic interactions and bridges the space between physical and digital worlds. Whether you’re tracking global QR code usage, optimizing mobile experiences, or designing customized QR codes that truly perform, the advantage is clear: better decisions, stronger engagement, and growth driven by facts—not guesswork.
