
Want to know if your QR code campaigns are actually working? Start with the right metrics. Understanding how users interact with your QR codes—how often they scan, when, where, and what happens next—is the key to optimizing your marketing strategies. In this guide, we’ll break down essential QR code engagement metrics, how to track them, and what they reveal about your audience.
Whether you’re using dynamic QR codes on print ads or tracking scan locations through Google Analytics, knowing your numbers makes all the difference.
Why QR code engagement metrics matter
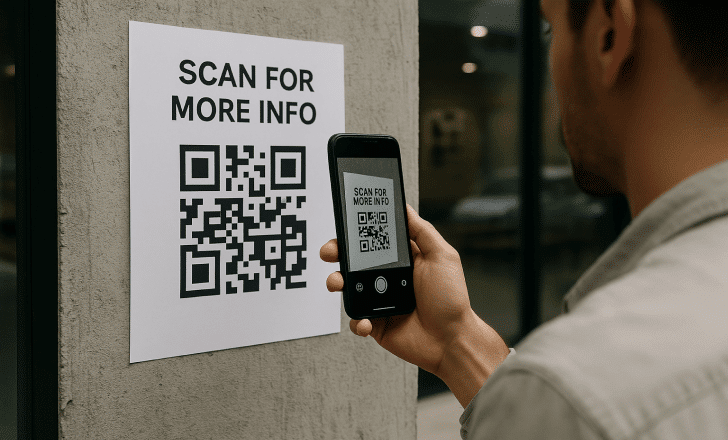
Let’s say you’ve added a sleek QR code to your product packaging or poster. You’ve got the design right, the placement perfect, and the call-to-action punchy. But how do you know if people are scanning it? And more importantly—what happens after the scan?
That’s where engagement metrics come in.
QR code engagement metrics help you track not just the number of scans, but also the quality of those interactions. Are users visiting your landing page? Are they taking action? Are scans happening in the locations you targeted?
Without tracking data, you’re flying blind.

Core QR code metrics you should be tracking
Here are the key performance indicators (KPIs) that actually tell you if your QR codes are working:
1. Total number of scans
The most basic—but still vital—metric. It shows how many times your QR code has been scanned. While it doesn’t reflect unique users, it does provide a sense of volume and momentum.
2. Unique scans
This metric tells you how many different people scanned your QR code. If your total scans are high but unique scans are low, it might mean people are scanning multiple times (which isn’t always a bad thing).
3. Scan locations
Understanding where users scan your QR code helps you evaluate campaign placement. Are people scanning at the event, in-store, or from a magazine at home? Location data gives you geographic insights to refine future campaigns.
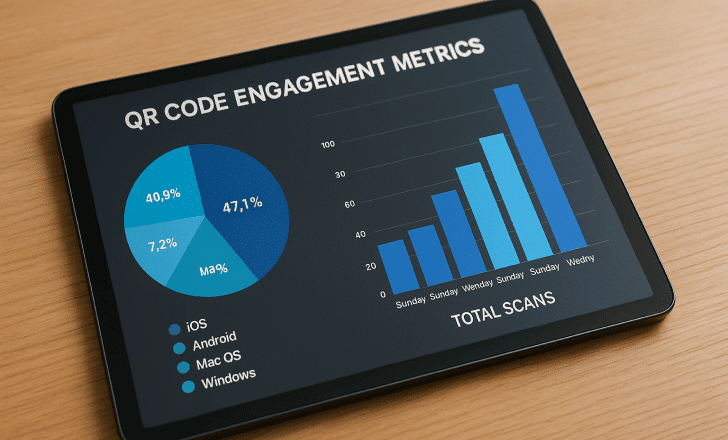
4. Devices and operating systems
Tracking which devices are used—iOS vs Android, mobile vs desktop—can shape your landing page optimization and content formatting.
5. Time of scan
Knowing when users scan helps tailor marketing messages and launch times. You may find spikes during weekends, lunch hours, or after specific social media posts.
Going beyond scans: How to analyze post-scan behavior
The scan is just the start. What happens after users scan the QR code is where true engagement lives.
1. Destination URL activity
If you’re using a dynamic QR code, you can redirect to different URLs without changing the printed code. But are users staying on the site? Are they bouncing?
Key data points here include:
- Bounce rate
- Time on page
- Click-through rates
- Conversion actions
2. Campaign effectiveness
By using UTM parameters, you can link QR scans to specific marketing campaigns and track them in your Google Analytics account. This allows you to compare QR code performance across different media—posters, flyers, email signatures, and more.

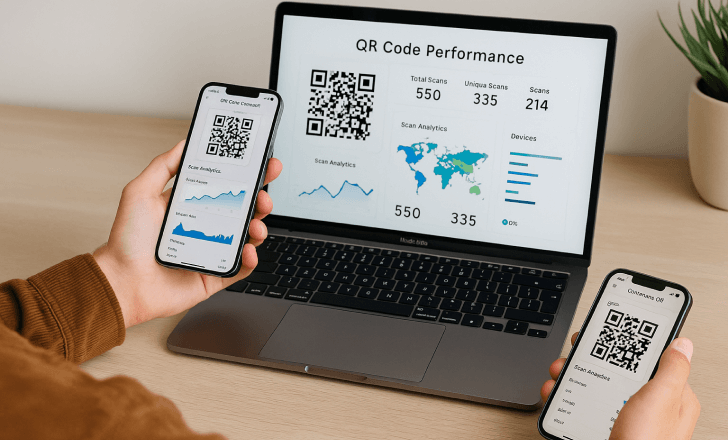
Tools for tracking QR code performance
To track QR code engagement efficiently, you need a platform that offers real-time analytics and integration with your existing tools.
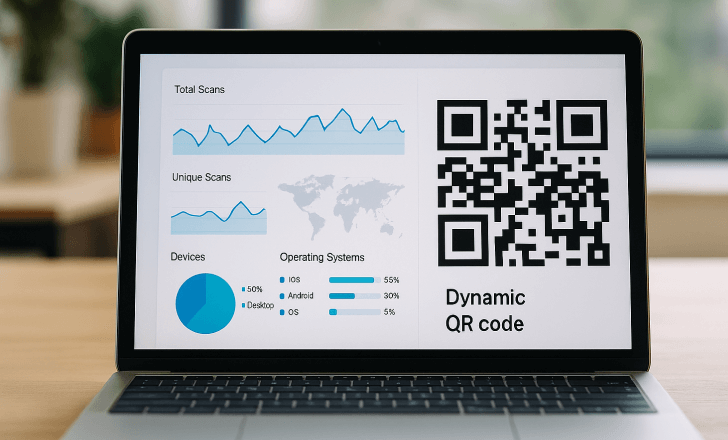
1. QR Code KIT and other dynamic QR platforms
A QR code generator like QR Code KIT offers built-in analytics tracking for dynamic QR codes, showing you scan volumes, locations, devices, and more. It simplifies tracking and helps marketers optimize on the fly.
2. Google Analytics integration
Integrating your codes with Google Analytics allows you to tie scan behavior to site traffic, goal completions, and ecommerce metrics. You’ll need to add UTM parameters to your QR code URLs for this to work.
3. CRM and automation platforms
Some marketers connect trackable QR codes to their customer relationship management (CRM) or marketing automation systems. This allows them to personalize follow-up messages, trigger automated workflows after a scan, and monitor long-term engagement patterns—turning each scan into the start of a tailored customer journey.
What you can’t track with static QR codes
Static QR codes are one-and-done. They can’t be edited or tracked after printing. That means no scan data, no analytics, and no performance feedback. If you want to make data-driven decisions, dynamic QR codes are the only way to go.
How QR code metrics improve your marketing strategies
Let’s look at a few real-world applications of scan analytics:
1. Print ads that actually work
You print 10,000 flyers, but only 50 people scan the QR. That’s important feedback. You might adjust your QR code placement, CTA, or design to boost visibility.
2. A/B testing with dynamic QR codes
Create multiple QR codes pointing to the same content but placed in different media. Analyze QR code scan data to see what works best.
3. Real-time campaign optimization
Is one version of your poster underperforming? With dynamic QR codes, you can change the destination URL instantly or shift traffic to a more effective landing page.

How often should you review QR code analytics?
Weekly during live campaigns, monthly for ongoing placements like packaging or product manuals. Regular review helps you:
- Catch problems early
- Optimize campaigns in real time
- Improve future campaigns using actual scan behavior
Remember: You don’t just want scans—you want results.
How to use scan data to shape future campaigns
Let’s say your QR code analytics reveal that users scan mostly at night. That insight could inform when you post social media reminders or send out emails.
Or maybe your scan locations cluster in a city you hadn’t even targeted. Now you know where to expand.
Use tracking data to shape messaging, placement, timing, and creative. That’s the beauty of QR code tracking—it’s not just insight; it’s action.
Can you improve QR code engagement without redesigning the whole campaign?
Yes. Sometimes all it takes is:
- Moving the code to a more prominent location
- Updating your call-to-action
- Switching to a more compelling landing page
- Highlighting a time-sensitive offer
Small changes can have big effects—especially when guided by real scan behavior.

Should you track individual users who scan QR codes?
That depends on your privacy policies. You can track sessions and aggregate behavior without collecting personal data. But if users log in or interact via forms, you may be able to tie scans to individual user engagement—especially with proper consent and CRM integration.
How do you know if your QR code is performing well?
Benchmark against past campaigns. Consider these tracking metrics:
- Growth in total scans
- Increase in unique scans
- Lower bounce rates
- Higher conversions
- Better campaign performance over time
No single metric tells the full story. Look at the whole picture to assess QR code effectiveness.
Final thoughts
Tracking QR code engagement metrics isn’t optional anymore—it’s essential. If you’re adding QR codes to your marketing campaigns, you need to understand what users do before, during, and after the scan.
From measuring user behavior to guiding your marketing efforts, the insights from QR analytics can shape smarter, more effective strategies.
Make every scan count.

What’s the best way to track QR code performance?
The best way to track QR code performance is by using dynamic QR codes paired with a QR code generator that includes built-in analytics. These platforms let you monitor scan counts, unique users, device types, and more. For deeper insights, you can also integrate your QR codes with Google Analytics using UTM parameters to track user behavior after the scan.
How can scan data improve marketing campaigns?
Scan data reveals what’s working and what isn’t. By analyzing when, where, and how often users scan your QR codes—and what they do afterward—you can refine marketing campaigns for better results. You’ll know which placements drive engagement, what times perform best, and which calls-to-action convert. That data helps you target smarter and waste less budget.
Why do dynamic QR codes offer better analytics than static ones?
Dynamic QR codes are editable and trackable, meaning you can update the destination URL even after printing—and see real-time engagement metrics. In contrast, static QR codes are fixed and provide no performance data. If you want to track scans, test variations, and measure outcomes, dynamic codes are the only reliable solution.
What are the most important QR code tracking metrics?
Key metrics include:
- Total scans: The overall number of interactions.
- Unique scans: How many individual users scanned the code.
- Scan locations: Where the QR code was scanned.
- Devices and OS: Which devices users used.
- Time and date: When scans occurred.
- Post-scan behavior: Actions taken after scanning, like clicks or conversions.
Together, these QR code engagement metrics help you evaluate campaign success and user behavior.

How can I integrate Google Analytics with QR codes?
You can integrate QR codes with Google Analytics by adding UTM parameters to your destination URL. These parameters track the source, medium, and campaign name, allowing you to see QR traffic in your analytics dashboard. When users scan the QR code, their session appears alongside your other marketing data, making it easy to compare performance.
What tools help me track QR code scans in real time?
QR Code KIT offer real-time scan analytics for dynamic QR codes. These tools show you immediate data like scan count, location, device type, and time of scan. For advanced tracking, combine these with your Google Analytics account or marketing automation tools to get a full view of the user journey.
How do I use QR code data to make data-driven decisions?
Start by identifying which QR codes perform best based on scan data and post-scan behavior. Use these insights to optimize your QR code placement, adjust your marketing messages, and test different campaign variables. Over time, tracking this data allows you to fine-tune your strategy for better user engagement and higher ROI.