TL;DR
- A QR code geography heatmap shows that adoption is concentrated and uneven, not uniformly “everywhere.”
- Asia-Pacific leads on payments, powered by India’s UPI, China’s wallet duopoly, and Southeast Asia’s linked national QR systems.
- Europe’s growth is regulation-led through the Digital Product Passport, the European Accessibility Act, and the GS1 Sunrise 2027 transition, while North America leans on marketing and packaging.
- Public sources measure different things, so country-level figures should be read as directional, not precise.
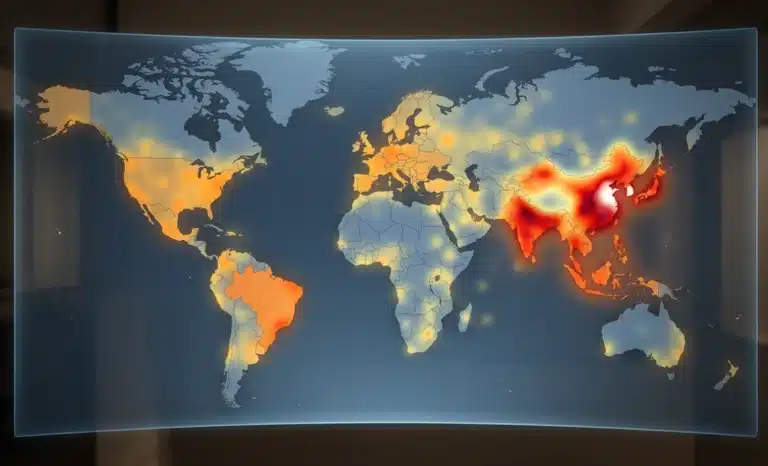
Search for a single number that captures global QR code adoption and you will find plenty of them. Few tell you much. A QR code geography heatmap is more useful, because it shows where scanning actually concentrates and why. The pattern is uneven by design. Asia runs on QR payments, Europe is moving under regulatory pressure, North America leans on marketing, and Latin America is building mobile-first commerce. This article maps QR code scans by country in 2026 using public data, and explains the structural reasons behind each region’s behavior.
What is a QR code geography heatmap, and why use one?
A QR code geography heatmap is a way of mapping QR adoption by country so the differences between markets become visible. It replaces a single global figure with a regional picture: who scans, for what, and how often. That view matters because the drivers behind a scan in Shenzhen, Stuttgart, and São Paulo have almost nothing in common.
The headline statistics make QR codes look like one global phenomenon. Juniper Research has projected worldwide QR payment spending approaching three trillion US dollars by 2025, up from about 2.4 trillion in 2022. That number is real and useful, but it flattens enormous variation, and the variation is where the strategy lives.
| Region | Primary QR driver | What it looks like in practice |
|---|---|---|
| Asia-Pacific | Payments | Everyday wallet payments at national scale |
| Europe | Regulation | Product passports, accessibility, GS1 transition |
| North America | Marketing and packaging | Promotions and CPG engagement, slower payment use |
| Latin America | Mobile-first commerce | Instant bank-led payments, informal merchants |
| Middle East and Africa | Financial inclusion | Mobile money, merchant payments, tourism corridors |
What do “scans by country” figures actually measure?
Not the same thing twice. Some sources count total scans, others count unique users, mobile payment penetration, or transaction value. A country can rank high on payment volume and low on marketing scans, or the reverse. Before comparing two markets, it is worth knowing which metric each source is reporting, because the categories rarely line up.
Payment data tends to be the most reliable, because central banks and national payment operators publish it directly. India’s National Payments Corporation of India, the Central Bank of Brazil, and Bank Indonesia all release transaction figures on a regular schedule. Marketing and packaging scan data, by contrast, comes mostly from private platforms and surveys, which use different sampling and definitions. The result is that payment-led regions are simply easier to quantify than marketing-led ones.
Why does Asia-Pacific lead the world in QR payments?
Asia-Pacific leads because QR codes arrived there as a payment rail first and a marketing tool second. Card penetration was historically low across much of the region, so a printed QR code linked to a bank account or wallet leapfrogged plastic entirely. The infrastructure was built around scanning, and everyday commerce followed.
China and the wallet duopoly
China set the template. As of mid-2024, the China Internet Network Information Center counted roughly 969 million mobile payment users, a figure reported through Statista. Two platforms, Alipay and WeChat Pay, handle the overwhelming majority of that volume, and QR codes remain the dominant way those payments are initiated, from large retailers down to street vendors. The market is now mature rather than growing, with attention shifting toward tap-to-pay layered on the existing QR base.
India and the UPI surge
India is the clearer growth story. According to NPCI figures published by the Government of India, the Unified Payments Interface processed about 228.3 billion transactions in 2025, with a record month of 21.63 billion in December alone. The International Monetary Fund has recognized UPI as the world’s largest real-time payment system by volume. For millions of small merchants, a static printed UPI QR code has effectively replaced both cash drawers and card terminals.
Southeast Asia and linked national systems
Southeast Asia is doing something distinct: connecting national QR systems across borders. Bank Indonesia reported roughly 6.05 billion QRIS transactions worth about 37 billion US dollars in the first half of 2025, with adoption concentrated among micro and small merchants. The first real-time link, between Thailand’s PromptPay and Singapore’s PayNow, launched in 2021, and the regional connectivity effort now spans eight national QR schemes including Cambodia, Indonesia, Laos, Malaysia, the Philippines, Singapore, Thailand, and Vietnam. A tourist can increasingly scan a local merchant’s code using a home-country app.
How is regulation shaping QR adoption across Europe?
Europe is the one region where the strongest driver is policy, not consumer habit. Three overlapping frameworks are pushing QR codes onto products and into services regardless of marketing appetite. Compliance, not convenience, is doing the heavy lifting, which gives European adoption a different texture from Asia’s.
The Ecodesign for Sustainable Products Regulation, Regulation (EU) 2024/1781, establishes the Digital Product Passport, a structured data record reached by scanning a code on the product. The European Commission has scheduled its supporting registry to open in 2026, and the EU Battery Regulation makes a battery passport, retrievable by QR code, mandatory from 18 February 2027. In parallel, the European Accessibility Act, Directive 2019/882, has applied since 28 June 2025, raising the bar for accessible digital destinations behind any consumer-facing code.
Layered on top is GS1 Sunrise 2027, an industry transition rather than a law, under which retailers expect point-of-sale systems to read two-dimensional codes by the end of 2027. Within Europe the pace varies. Germany, France, and Italy move first under manufacturing and retail pressure, the UK tracks the GS1 transition closely, and tourist-heavy markets like Spain lean on multilingual destinations behind a single code.

Why does North America favor QR for marketing over payments?
North America inverts the Asian pattern. Payments came late because cards already worked well, so QR codes found their footing in marketing, promotions, and packaging instead. The scan is a bridge from a physical surface to a campaign, not a substitute for a payment terminal.
The usage data fits that story. eMarketer figures reported through Statista put US QR scanner users near 100 million by 2025, climbing from about 89 million in 2022, and a 2021 consumer survey found that almost half of US shoppers had scanned a code to reach a marketing or promotional offer. Consumer packaged goods and retail brands drive much of this, using codes on packaging for product information, authentication, and loyalty. Canada follows a similar marketing-first pattern, with added momentum from packaging and traceability requirements that echo Europe’s direction.
What makes Latin America a mobile-first QR market?
Latin America’s QR story is about leapfrogging, much like Asia’s, but led by public payment infrastructure. Brazil is the anchor. The Central Bank of Brazil reports that its Pix system is used by more than nine in ten Brazilian adults, and QR codes are a core way Pix payments get initiated, from supermarkets to street artists collecting tips.
Pix has reshaped merchant behavior because its cost to businesses is a fraction of card fees, which is why many retailers actively prefer it. Person-to-merchant QR payments run into the billions of transactions per month, according to analysis from the US Faster Payments Council. The pattern extends across the region in different forms: Mexico, Argentina, Chile, and Colombia each show growing QR use anchored in everyday and informal commerce, where a printed code lets a small or unbanked-leaning merchant accept digital money without hardware.
How quickly are the Middle East and Africa adopting QR?
This is the region to watch, because growth is fastest here even though the base is smaller. In sub-Saharan Africa the foundation is mobile money rather than card or bank-app payments. The GSMA’s State of the Industry report found that more than two trillion US dollars flowed through mobile money wallets globally in 2025, with about 1.4 trillion of that in sub-Saharan Africa alone.
Africa accounted for the majority of mobile money accounts and roughly two-thirds of global transaction value, according to the same GSMA data, and merchant payments were the fastest-growing use case, reaching around 155 billion US dollars in 2025. Much of African mobile money still runs on phone numbers and basic handsets rather than scanning, but merchant QR acceptance is where the new growth concentrates. In the Gulf, the United Arab Emirates and Saudi Arabia are expanding QR use in payments and tourism, while South Africa applies it in retail and logistics. The GSMA has flagged the wider Middle East and North Africa as a region showing notable acceleration.
What explains the differences between regions?
The regional split is not random. Five structural factors decide whether a country adopts QR for payments, for compliance, or for marketing, and in what order. Reading a heatmap well means reading these drivers underneath it.
- Payment infrastructure: where national instant-payment rails exist, QR payments scale fast.
- Regulatory landscape: product passport, accessibility, and traceability rules force adoption regardless of consumer demand.
- Smartphone penetration: scanning needs a camera in every pocket, which sets the ceiling on adoption.
- Banking system maturity: low card penetration tends to accelerate QR payments, since there is less incumbent infrastructure to displace.
- Retail concentration: fragmented, small-merchant economies favor cheap printed codes over terminals.
What does the QR geography mean for cross-region businesses?
For a business operating across several regions, the heatmap is a planning tool, not trivia. The same code serves a different job in each market, so a single global rollout rarely fits. The practical implications are concrete and worth budgeting for separately by region.
- Localized content: a scan in a tourist market may need to resolve in several languages from one code.
- Regulatory readiness: products sold into the EU should anticipate Digital Product Passport and accessibility expectations now, ahead of the 2027 deadlines.
- Payment integration: in Asia and Latin America, a QR experience that ignores local payment rails leaves friction on the table.
- Update flexibility: because regulations and campaigns change, dynamic QR codes that update without reprinting reduce long-term cost and risk.

What does public QR data fail to capture?
Quite a lot. Country-level aggregates tell you how much scanning happens, but not the texture of it: which individual codes get scanned, at what time of day, in which language, or how often a destination changes behind a fixed printed code. Public figures are a satellite view, useful for direction and weak on detail.
This is where platform-level data adds a layer that public sources cannot. A provider that has worked across these markets for years, QRCodeKIT among them with dynamic QR codes since 2009, sees scan-by-scan behavior that no national statistic exposes. None of that contradicts the public picture. It sits underneath it, and it is the layer where a specific campaign or product line is actually managed. The heatmap tells you where to look. The granular data tells you what to do once you are there.
Which country has the highest QR code usage in 2026?
It depends entirely on the metric. By payment transaction volume, India leads through UPI, with NPCI reporting hundreds of billions of transactions a year. By share of population using QR payments, China and Brazil are at or near the top. By marketing and promotional scans, the United States ranks highly. There is no single winner, only different leaders for different uses.
Why did QR payments grow faster in Asia than in the US?
Because the starting conditions were opposite. Much of Asia had low card penetration, so a QR code linked to a bank account or wallet offered a cheaper, faster path than building card infrastructure from scratch. The United States already had a deep, functional card system, so QR payments solved a smaller problem and grew mostly as a marketing channel instead.
Are QR code scans by country directly comparable across sources?
Usually not. One source may report total scans, another unique users, payment value, or survey-based recall. Central bank and national operator payment data is the most consistent and citable, while marketing scan data varies by methodology. The safest approach is to compare like with like, and to treat cross-source country rankings as directional rather than exact.
Will Europe’s QR adoption overtake Asia’s?
Unlikely on payment volume, where Asia’s lead is structural and large. But Europe is building a different kind of depth. Regulation-driven adoption through product passports and accessibility rules embeds QR codes into products and services in ways consumer habit alone would not, which could give Europe the densest regulated QR footprint even if it never matches Asia’s payment scale.
How can a business use a QR code geography heatmap?
Treat a QR code geography heatmap as a market-entry filter. Use it to decide whether a given country rewards a payment-first, compliance-first, or marketing-first QR strategy, then localize content, language, and payment integration to match. The map sets the regional strategy. Scan-level platform data then guides the specific execution within each market.
All images and visual content in this article were created using RealityMAX.