May 8, 2026
What is the average reprint cost by sector for static printed content?
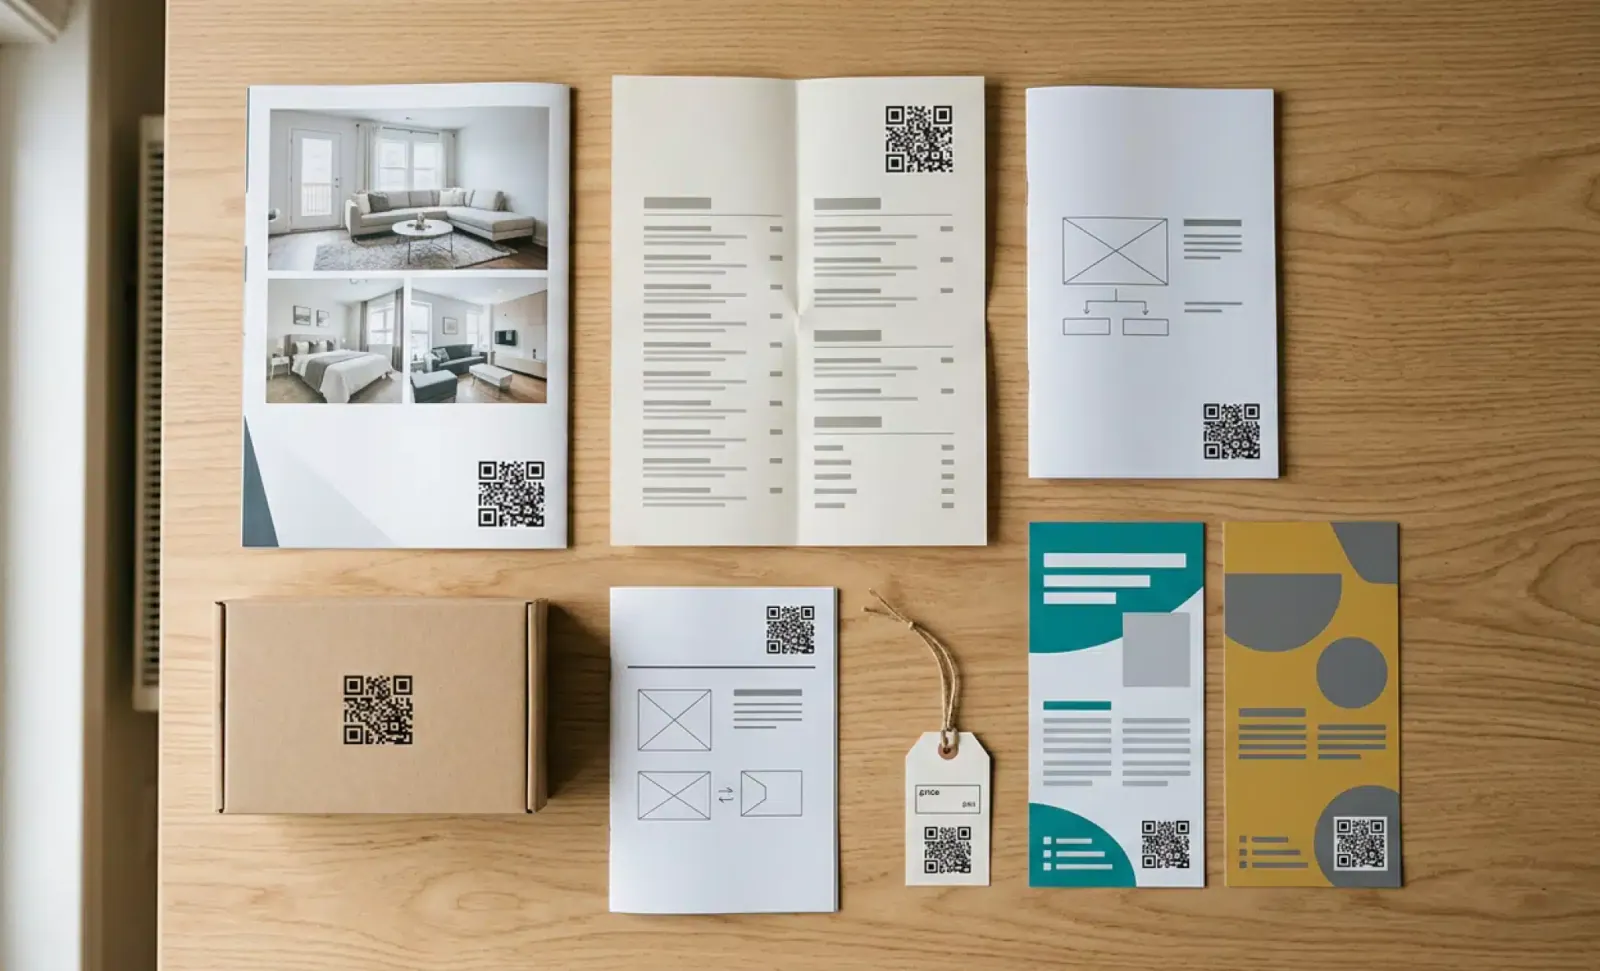
Most companies do not have a clear line item called “reprinting” in their budgets. The cost is spread across design hours, marketing campaigns, store openings, regulatory updates and operations. That is exactly why printing costs tend to grow unchecked. Once you sum it up, the average reprint cost by sector for static printed content is rarely small. In some industries it is one of the largest recurring fixed costs that nobody fully tracks.
Industry estimates suggest businesses spend approximately 3% of their annual revenue on print related expenses, and printing costs including reprints generally account for 1% to 3% of total company revenue. In high-volume sectors such as legal, healthcare and publishing, that share can climb much higher. Publishing and media printing alone can consume roughly 10% to 20% of gross revenues. Despite this, around 90% of companies do not track their printing costs in any structured way, which turns inefficiencies, labor, consumables and vendor costs into a hidden drain on budgets.
This article looks at what businesses actually spend reprinting menus, brochures, manuals, signage and packaging inserts. It breaks down where the costs hide, gives realistic ranges by industry and explains why dynamic QR codes can remove most of the recurring portion of those expenses.
What does static printed content really mean for a business?
Static printed content is any physical material a company produces with information that will, sooner or later, become out of date. Menus and table cards in restaurants. Shelf signage, price tags and product brochures in retail. Property brochures and window cards in real estate. Event programs, badges and signage. Product manuals and safety inserts in manufacturing. Patient leaflets and posters in healthcare. The format varies, but the pattern is the same: information is locked into paper at a moment in time.
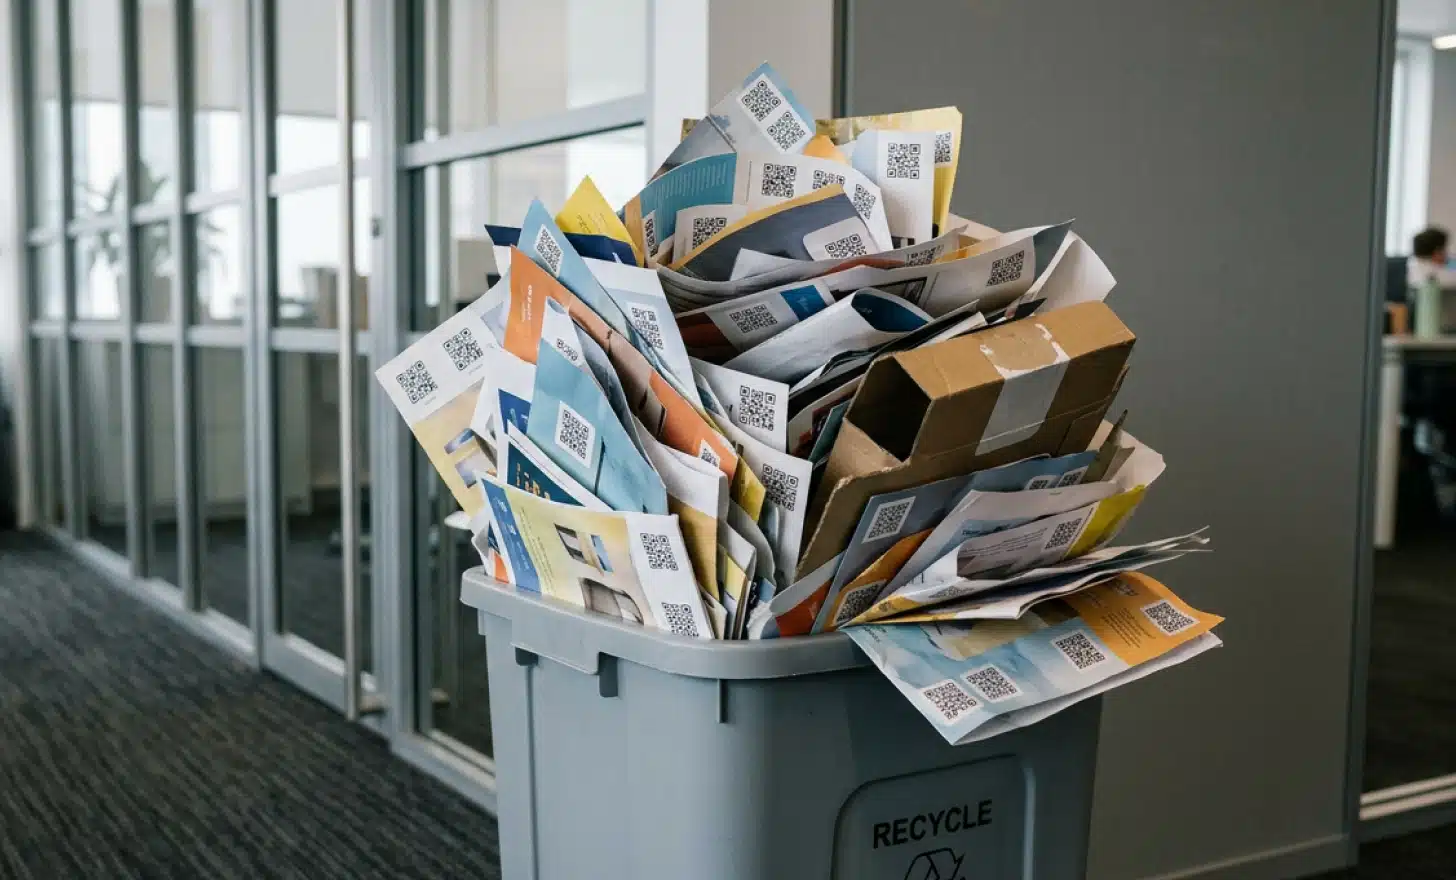
The reprint cost shows up every time that information needs to change. Sometimes the change is planned, like a seasonal menu or a quarterly campaign. Sometimes it is forced, like a regulatory update or a price correction. Either way, the only way to reflect the new reality is to print again. And when print runs are repeated frequently, even small inefficiencies compound. An estimated 65% of printed documents are recycled or thrown away the same day they are printed, which gives a sense of how much paper ends up wasted before it ever delivers value.
Where do hidden printing costs and fixed costs actually sit?
When companies estimate reprint cost, they usually count the obvious part: paper and printing. The full picture is wider. A reprint cycle typically involves several layers, and the printing run itself is often the smallest of them. Industry research consistently shows that for every $1 spent on printing, companies spend another $9 to $15 managing it, which includes IT support, network infrastructure, help desk calls and administrative overhead.
In most organizations, design rework, distribution, disposal and management overhead together cost more than the printing run. Black-and-white prints typically cost between $0.01 and $0.08 per page, while color printing costs significantly more, so the unit price is rarely the bottleneck. The real burden is everything around it: the desk calls to fix broken queues, the vendor coordination, the obsolete stock sitting in storage. This is the part that does not appear in any single invoice, which is why so many businesses underestimate what reprinting actually costs them on an annual basis.
There is also an inflation dimension that has become harder to ignore. Tariffs and import duties have driven up the cost of imported paper, ink and machinery spare parts, with raw materials and imported finished goods increasing by an average of 15%. In inflationary environments, operational cost inflation can outpace price increases in commercial printing, which means margins compress on both sides at once.
What is the average reprint cost by sector?
There is no single benchmark that applies to every business. Reprint cost depends on volume, paper quality, design complexity and how often content changes. The ranges below are based on publicly available industry estimates from print management providers, packaging analysts and procurement reports. They are presented as orders of magnitude, not exact prices, and should be calibrated against your own supplier quotes. As a rule, higher print volumes reduce the unit cost due to economies of scale, which is why offset printing is cost-effective for large bulk runs while digital printing is better for smaller, varied reprints.

Hospitality
Restaurants, hotels and bars reprint menus and table cards more often than most operators realize. A medium sized restaurant typically refreshes its menu two to four times a year, and many do partial reprints whenever a dish, allergen or price changes. Industry benchmarks from menu print providers commonly place the cost of a full menu reprint between $200 and $4,000 per venue per cycle, depending on paper, format and whether multiple language versions are needed. For groups operating dozens of locations, the annual total quickly reaches six figures.
Retail
Retail is the sector where reprint cost is most fragmented and hardest to track. Shelf signage, price tags, end cap posters and seasonal brochures all follow different cycles. Individual shelf tags can cost only a few cents to print, but a full store rollout that combines signage, brochures and promotional posters easily reaches the $1,000 to $20,000 range per location depending on store size and campaign frequency. Multiply that by every store and every promotional cycle and the total is significant. This is also the sector where supply chain disruption hits hardest, because frequent reprints mean continuous exposure to paper and ink price swings.
Real estate
Real estate agencies sit between two reprint problems. Property brochures need to be high quality, and they go obsolete the moment a price changes or a property sells. The unit cost of a glossy property brochure ranges from $2 to $8, but the meaningful cost includes design fees, photography updates and the brochures that are simply thrown away when a listing closes. Agencies running many active listings often print thousands of brochures a year, with a measurable share never reaching a buyer.
Events
Events are reprint cost compressed into days. A single conference can spend between $3,000 and $50,000 on printed programs, signage, badges and sponsor inserts, with the wider end of the range reflecting larger trade shows and corporate events. The painful part is timing. Last minute speaker changes, sponsor additions and schedule edits often arrive after printing has started, forcing partial reprints or accepted inaccuracies. Direct mail, posters and event materials in print can stand out in a saturated digital landscape, which is why event organizers continue to invest in them despite the cost.
Manufacturing
Manufacturers carry one of the heaviest documentation burdens. Product manuals, technical documentation and safety inserts must be accurate, often in multiple languages, and updated every time a product, regulation or component changes. A printed manual can cost between $5 and $40 to produce per unit depending on length, paper and binding, and translation can multiply both production and revision costs. For products sold internationally, even a small change can trigger reprints across many language versions. In sectors like manufacturing, print remains a practical necessity for managing compliance documents and manuals that are easier to handle in physical formats on the shop floor.
Healthcare
Healthcare leaflets and posters look inexpensive per unit, often between $0.10 and $1.50 at scale, but the real cost lives in compliance review, version control and book production for patient education materials. Every change must be approved, documented and rolled out across clinics, pharmacies and waiting rooms. Multilingual versions add another layer. High-volume sectors such as legal and healthcare face higher printing costs overall due to greater demands, and the risk of patients reading an outdated leaflet is also a cost in itself, even if it never appears on an invoice.
How much do companies spend on printing per employee?
The per-employee figure is one of the most useful ways to size hidden printing costs. The average employee’s printing habits cost a company approximately $725 per year, with employees printing around 9,000 pages annually, of which nearly 20% go unread. That waste is essentially a fixed cost embedded in payroll: it scales with headcount, not with output.
When that figure is combined with the multiplier mentioned earlier (every $1 of printing creates $9 to $15 of management overhead), the picture changes substantially. A 200-person company spending $145,000 a year on direct print costs is realistically spending well into seven figures once IT support, vendor management, help desk calls and infrastructure are included. The fact that the average reprint cost by sector rarely shows up cleanly in financial statements is a feature of how those expenses are allocated, not a sign that they are small.
Why does reprint cost grow over time?
Reprint cost rarely stays flat from one year to the next. Several forces push it upward, and most of them are outside the procurement team’s control.
- Regulatory changes that force updates to manuals, leaflets and labels.
- Multilingual expansion, where every language version multiplies design and translation work.
- Rebrands and visual identity refreshes that obsolete entire stocks of printed material.
- Seasonal updates, promotional cycles and new product launches.
- Error corrections, which are the most expensive reprints because they are unplanned.
- Tariff and supply chain pressure on imported paper, ink and spare parts.
Each of these is reasonable on its own. Together, they explain why the reprinting line of the budget tends to drift upward year after year, even when paper prices look stable on paper.
Put it into practice
Create a dynamic QR code free and see it work. No credit card required.
Get started freeHow does print management software help organizations save money?
Print management software addresses the layer most companies cannot see. By tracking devices, queues, users and volumes in one place, it identifies inefficiencies in printing habits, such as unnecessary prints, color jobs that should have been black and white, and duplicated runs across departments. Implementing print management software can therefore help organizations save money by reducing waste at the source rather than after the fact.
Strategic print management solutions optimize workflows, enforce policies and provide visibility into usage, which helps organizations reduce waste and improve efficiency over time. Managed Print Services (MPS) contracts go further, bundling devices, supplies, support and analytics under a single agreement. Industry research consistently shows that MPS can reduce operating costs by 20% to 30%, with the largest savings typically coming from consolidating fleets, reducing help desk calls and shifting volume from inefficient devices to optimized ones.
Companies that lack a management information system for tracking print costs often struggle to differentiate between profitable and unprofitable print jobs, which leads to inefficiencies that quietly compound. The starting point is usually as simple as turning on usage tracking. Once the data exists, decisions about reprints, vendors and formats can be made on evidence rather than habit.
How can on-demand printing and AI reduce printing costs further?
Waste reduction strategies increasingly point in one direction: shifting to on-demand printing to eliminate over-printing materials. Instead of printing thousands of brochures or manuals upfront and storing them, on-demand workflows produce smaller, more frequent runs aligned with actual use. Digital printing makes this economically viable because it allows for frequent updates and personalization for smaller runs, which traditional offset cannot match at low volumes.
AI is transforming how businesses manage and produce printed materials by automating design processes, which reduces reliance on manual work and speeds up production times. Machine learning enhances variable data printing, allowing businesses to tailor content based on customer behavior, location or preferences, delivering targeted experiences at scale. Smart systems powered by AI also analyze usage patterns to forecast demand, reduce waste and streamline inventory, leading to more efficient print runs and lower total cost.
The combination matters. On-demand printing prevents the obsolete stock problem. AI-driven design and forecasting prevents the overproduction problem. Together they shrink the volume that ever needs to be reprinted in the first place.
How do dynamic QR codes change the equation?
Dynamic QR codes change the relationship between physical material and the information it carries. With a static printed page, the content and the paper are locked together. Update the content and you reprint the paper. With a dynamic QR code, the printed object stays the same and the destination behind it can be edited at any time.
In practice this means a menu, a brochure, a manual or a poster can carry a single printed code that always points to the current version of the information. Prices change in the back end, not on paper. New languages are added without a new print run. A safety update reaches every product instantly because the manual lives behind the code, not inside it. The physical material becomes a stable carrier, and the content becomes editable.
This does not eliminate printing. Print continues to serve specific, high-impact roles across industries, complementing digital tools rather than competing with them. Printed materials such as brochures and business cards provide a physical presence that digital assets cannot replicate, often serving as a lasting first impression. What dynamic QR codes change is how often those objects need to be reprinted. Many of the cycles described above stop being driven by content changes and start being driven only by physical wear, rebrands or genuinely new formats.
Platforms like QRCodeKIT support this pattern natively. Every QR code on QRCodeKIT is a dynamic QR code, which means the destination and the information it serves can be updated without reprinting the physical code. Cleo, the AI assistant built into QRCodeKIT, takes the idea a step further by letting people scan the same printed code and ask questions in conversation, getting answers drawn from the latest content the owner has configured.
When does static printed content still make sense?
Reducing reprints is not the same as eliminating printing. Some categories of printed content are deliberately static and should stay that way.
Regulatory labels with mandated text and layout, for example, must follow strict rules about what appears physically on the product. Official documents, certificates and contracts often need to be archived in fixed form. In sectors like healthcare, legal and manufacturing, print remains a practical necessity for managing compliance documents, patient forms and manuals, which are often easier to handle in physical formats. Materials with no update cycle, such as printed art, signage tied to a permanent address or collateral for a one off event, do not benefit from being editable because they were never going to change.
Businesses that understand when and how to use print effectively are able to maximize the benefits of both print and digital strategies. The honest framing is this: dynamic QR codes are designed to remove the cost of reprinting content that changes. Where content is supposed to stay frozen, traditional printing remains the right choice.
How can a business calculate its own reprint cost?
A useful exercise for any operations or finance team is to build a one page reprint map. List every category of printed material the company produces. For each, write down how many times it was reprinted in the last twelve months, the unit cost, the volume per print run and the design or translation work each cycle required. Add distribution, disposal and management overhead where they are material. The total is usually higher than expected, and the breakdown shows which categories are driven by content changes versus genuine physical wear.
That map is also the right starting point for deciding where dynamic QR codes can help. The categories where reprints are caused by information changes, not physical degradation, are the ones where dynamic content delivers the largest savings. Pair that view with print management software data on actual device usage and you have a complete picture of where the money goes and where it can be reduced.
Frequently asked questions
How much do companies typically spend on printing per employee per year?
The average employee’s printing habits cost a company approximately $725 per year, with employees printing around 9,000 pages annually and nearly 20% of those pages going unread. Industry print management studies generally place total office printing costs in the range of $600 to $1,400 per employee per year, depending on sector and digital maturity. Customer-facing printed content like menus or brochures sits in marketing or operations budgets and should be counted on top of that.
Are reprint costs usually included in marketing budgets?
Often only partially. Design and creative work tend to live in marketing, while paper, printing runs, distribution and management overhead can sit in operations, procurement or store budgets. This split is one of the main reasons total reprint cost is hard to see at a glance. Building a single view across departments, ideally supported by print management software, is usually the first step toward reducing it.
Can dynamic QR codes fully replace reprinting?
They can replace the reprints that are caused by information changes, which is the largest category for most businesses. They cannot replace reprints driven by physical wear, rebrands or formats that have to change physically. A realistic expectation is that dynamic QR codes remove most of the recurring content driven reprint cost while leaving genuinely physical changes untouched.
How do dynamic QR codes affect the environmental impact of printing?
By extending the useful life of each printed object, dynamic QR codes reduce paper consumption, ink usage and disposal of obsolete stock. Given that an estimated 65% of printed documents are recycled or thrown away the same day they are printed, any reduction in unnecessary reprints has a meaningful effect on waste. Companies that track sustainability metrics often see measurable reductions in paper waste once content is moved behind dynamic codes.
What kind of printed content benefits most from dynamic QR codes?
Anything that combines a stable physical format with information that changes. Menus, product brochures, manuals, property listings, event programs and patient information leaflets are all strong candidates. The more often the content changes, and the more languages or versions it needs, the larger the savings from making the destination editable rather than the paper.
Once a business has a clear view of its reprint cost by sector and category, the decision becomes simple. Keep printing where the content is meant to stay fixed. Move everything else behind a dynamic QR code, and stop paying to reprint information that was never supposed to be permanent in the first place.
All images and visual content in this article were created using RealityMAX.
Related articles

QR code is a regulation
For most of its life, the QR code was a marketing object. A campaign asset. Something a creative director argued for and a CFO tolerated. That era is ending.…
GS1 sunrise 2027
The barcode you have been printing on every product for the last forty years is on a deadline. By the end of 2027, the retail industry expects packaging to…

How AI QR codes work?
An AI QR code is a dynamic QR code with a conversational AI layer waiting at the destination. The pattern on the wall looks like any other QR code. What…
Two free dynamic QR codes. Yours forever.
No credit card. No expiry. The original dynamic QR platform since 2009.